
Home Lab Dashboard
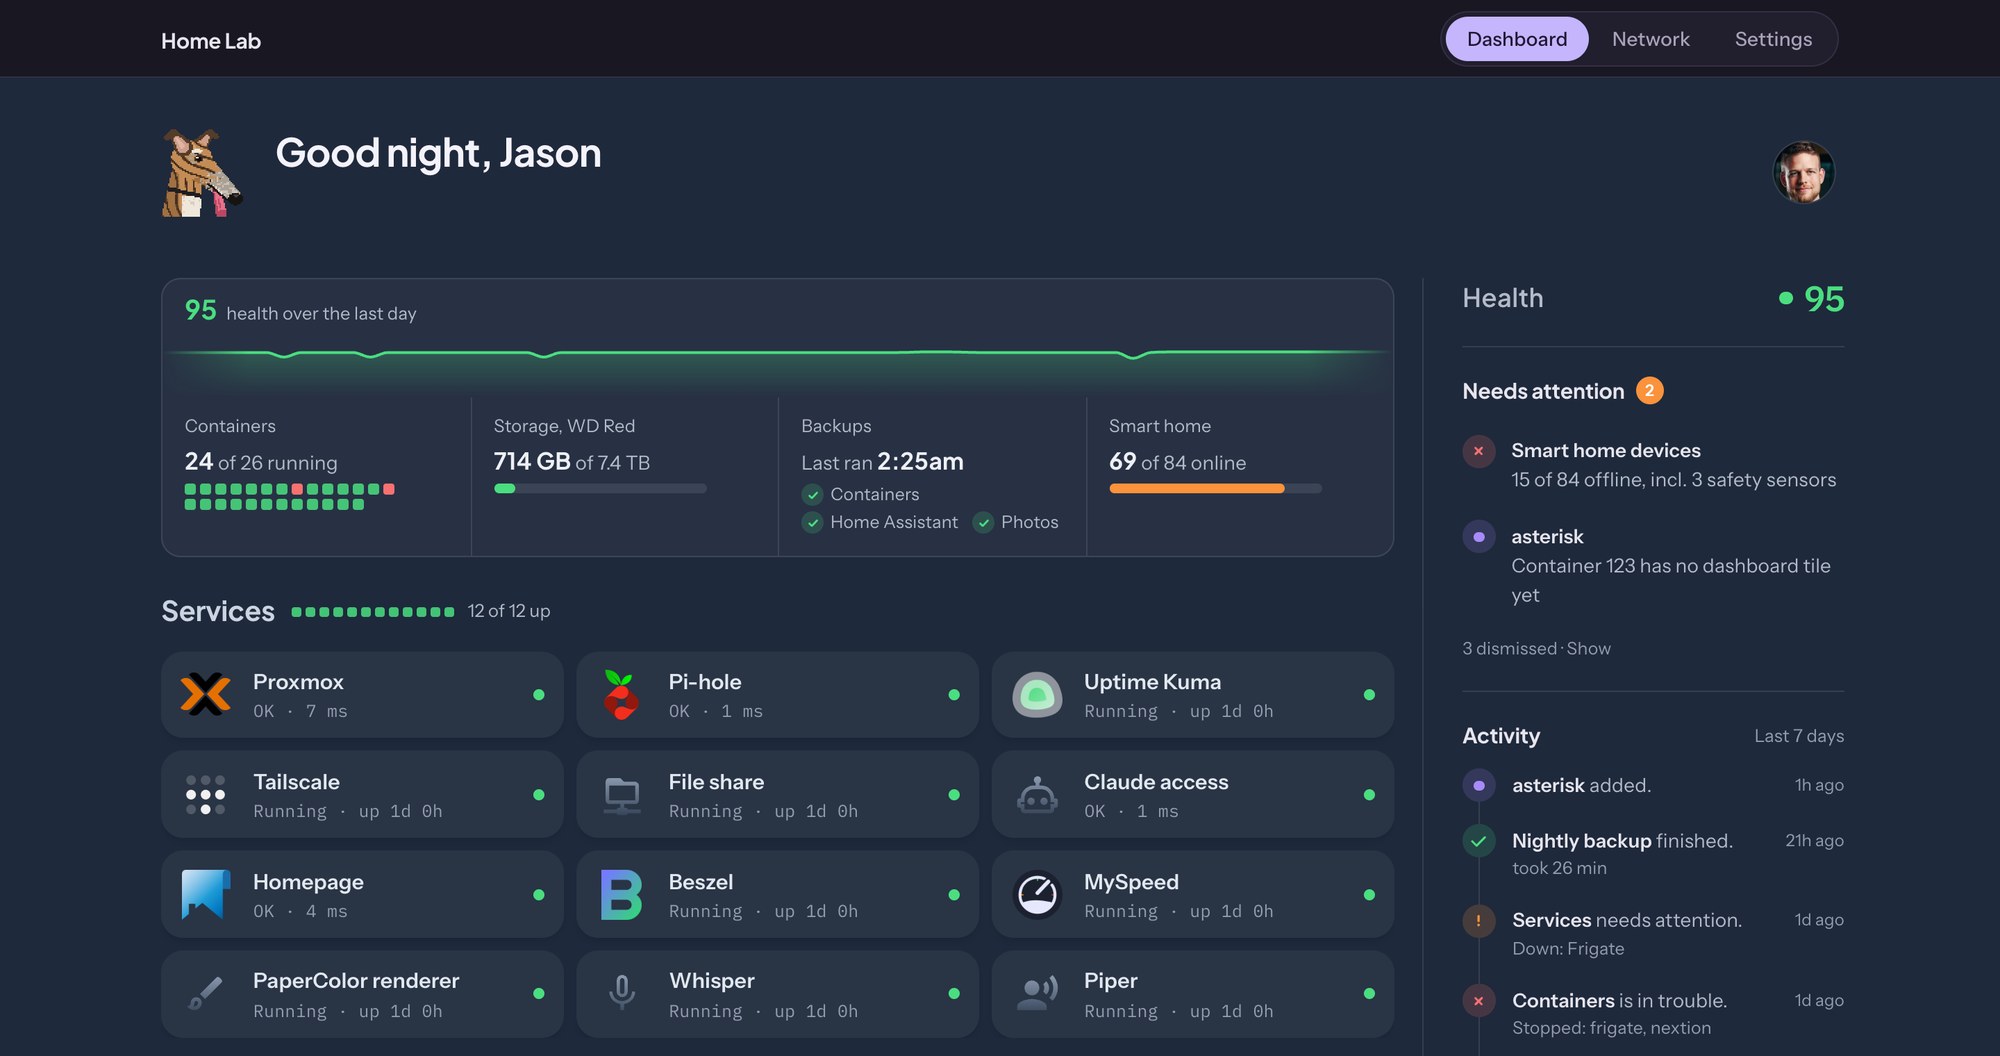
A dashboard for the server in my house. It started as a stock Homepage install and grew into its own thing: a single health score, a short list of what needs attention, every service and device, and a map of the network.
July 2026
Why I Built This
My home lab is an old Acer laptop running Proxmox, with a couple of dozen containers on it: photo backup, DNS, Home Assistant, and the small servers behind my other projects. Each one has its own status page. What I wanted was one page that answers a single question: is everything okay, and if not, what should I look at?
Homepage, the open source dashboard, got me a grid of tiles quickly. The rest is custom: about 1,900 lines of JavaScript and as much CSS layered on top of it, fed by a small service on the server I call the scorekeeper.
One Score
The scorekeeper rolls everything up into a health score out of 100 and keeps a day of history, so a dip overnight is still visible in the morning. Under the score, a summary strip covers the four things I check most: how many containers are running, how full the storage drive is, when the backups last ran, and how many smart home devices are online.
The rail on the right is the part I use most. Needs attention lists the things that are wrong right now in plain words, and each item can be dismissed until it changes. Activity is a running log of the last week: a backup finished, a container stopped, the server restarted.
Services and Devices
Each service is a compact tile with its state and response time, which comes from Uptime Kuma. Clicking a tile opens a popup with details, a short description of what the service is for, and a troubleshooting write-up, so I don't have to remember how I set something up a year ago.
A devices table lists everything on the network with an owner: me, my partner, or shared. The avatar in the header switches between three profiles. Shared hides the server internals, so the dashboard is still useful to someone who only wants to know whether the photos backed up.
The Network Map
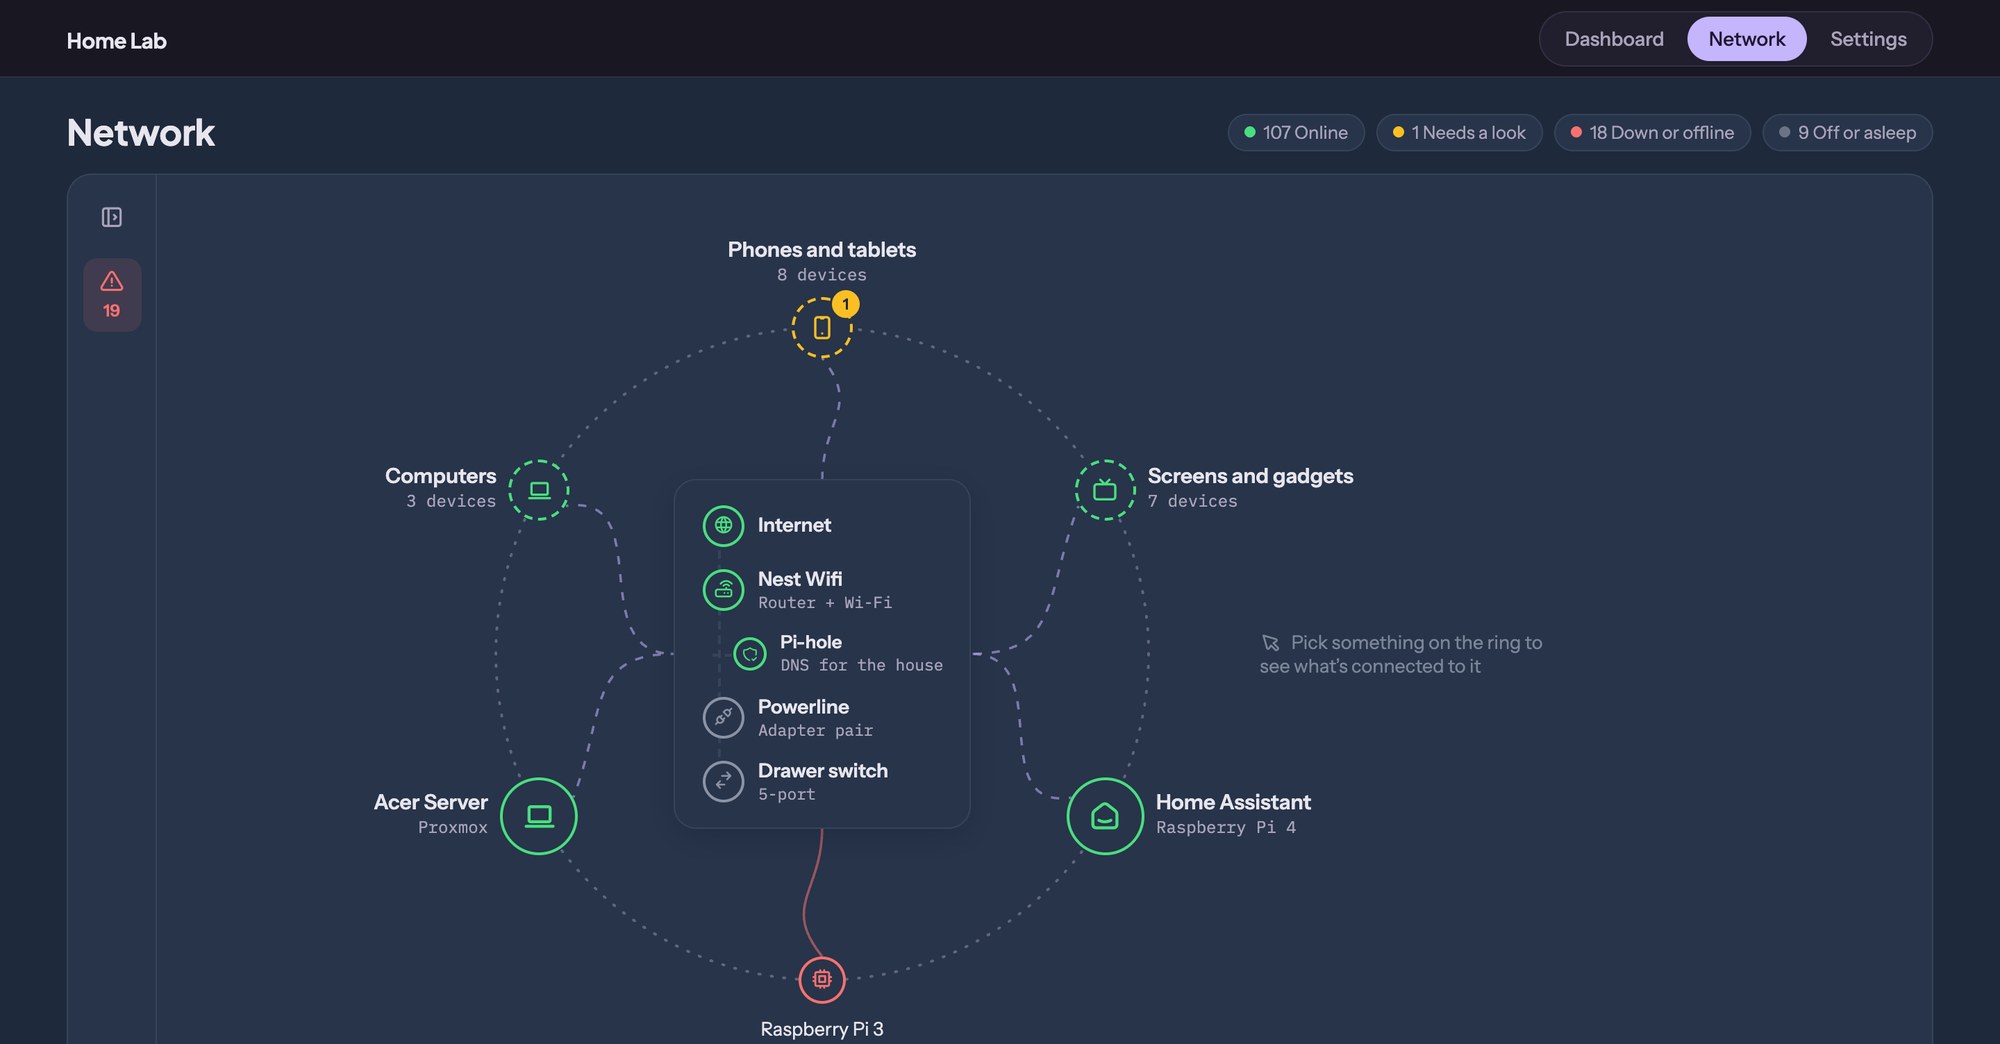
A second page draws the network as a map: the router and switches in the middle, and rings for computers, phones, screens, and the servers. Picking something on a ring shows what's connected to it.
Two Themes
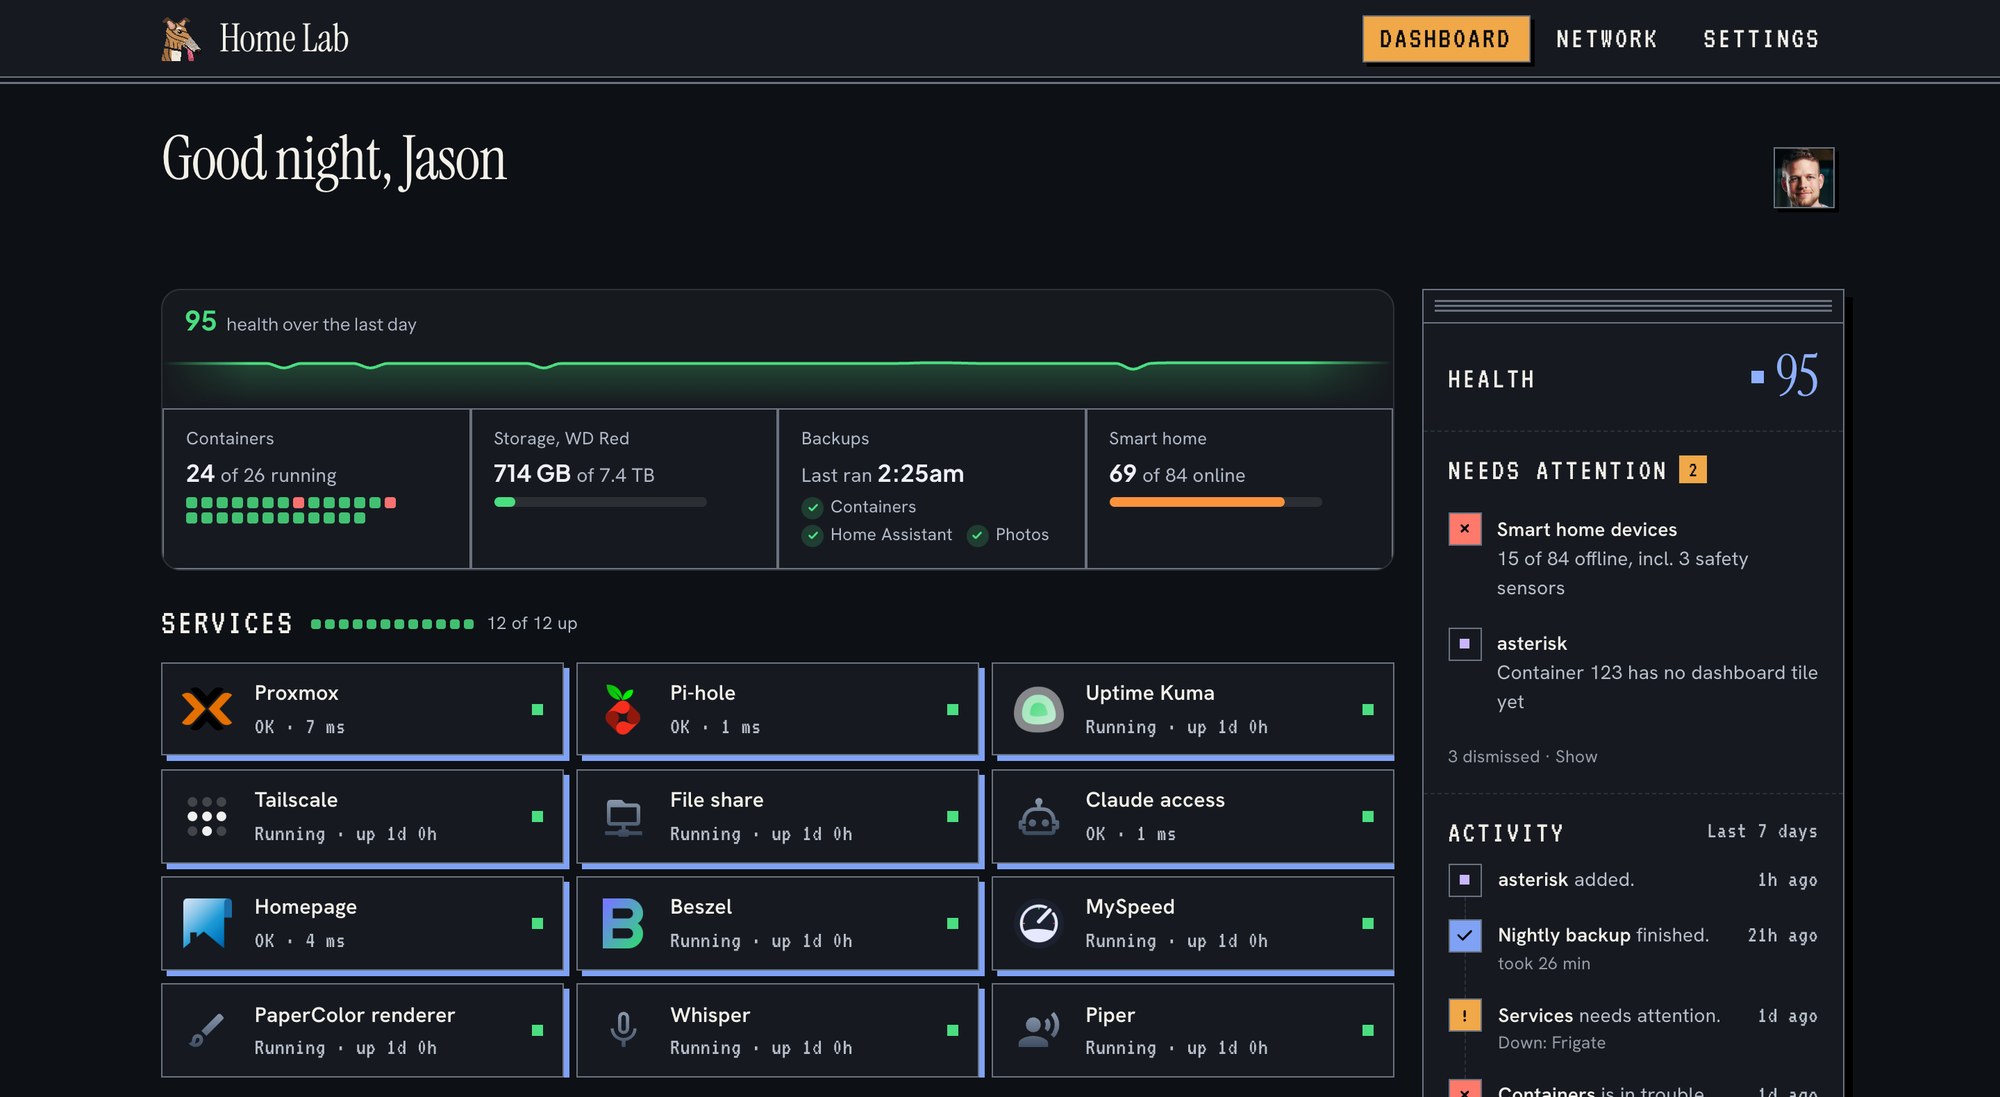
There are two skins. Classic is the default. Retro swaps in serif type, square corners and hard outlines, and has its own startup screen. The choice is remembered per browser.
Key Features
| Feature | Description |
|---|---|
| Health score | One number out of 100 with a day of history. |
| Needs attention | What's wrong right now in plain words, dismissable until it changes. |
| Activity log | A week of backups, restarts, and containers stopping and starting. |
| Service tiles | State and response time, with a details popup and troubleshooting notes for each. |
| Devices | Everything on the network, with an owner for each device. |
| Profiles | Shared, mine, and my partner's, switched from the header. |
| Network map | A second page that draws the network and what's connected to what. |
| Themes | Classic and Retro, each in light and dark. |